Calorie Calculator
Calculate your total daily calorie requirements using scientifically validated formulas
Calorie Calculation Method
1 lb/week
0.5 lb/week
Macro Distribution
Important Limitations
These calculations are starting points, not definitive answers. Research shows calculator accuracy varies by ±325 calories on average. Only 20% of users receive highly accurate recommendations.
Implementation: Track results for 3-4 weeks at the recommended calories. If you’re not seeing expected changes, adjust by 100-200 calories rather than recalculating. Most people overestimate activity level – consider starting conservatively.
Metabolic adaptation is real. Your metabolism adjusts as you lose or gain weight. Expect to recalculate every 5-10 pounds or when progress stalls for 2+ weeks.
BMR and Daily Calorie Needs
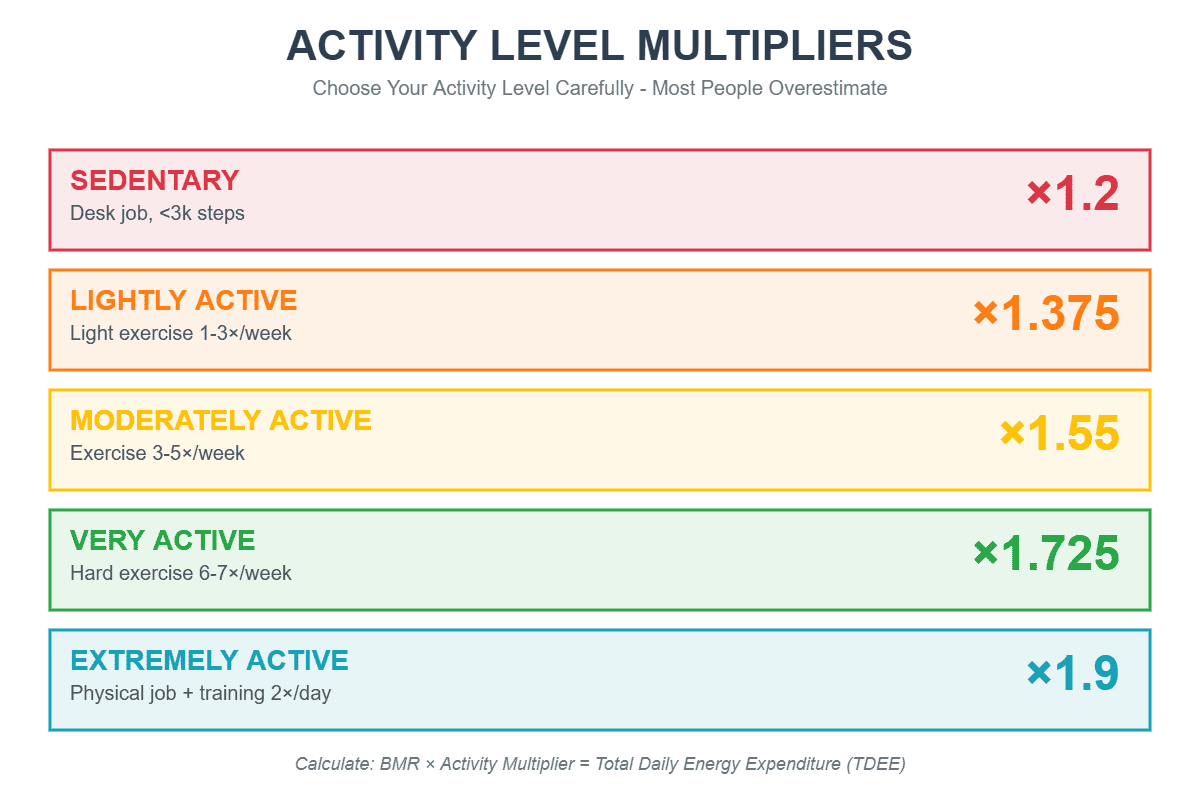
Your Basal Metabolic Rate represents calories burned at complete rest. Total daily needs multiply BMR by activity level. Most people overestimate their activity by 1-2 categories, so start conservative.
| Activity Level | Description | Multiplier |
|---|---|---|
| Sedentary | Desk job, minimal walking, <3,000 steps daily | ×1.2 |
| Lightly Active | Light exercise 1-3 days/week, 3,000-5,000 steps | ×1.375 |
| Moderately Active | Exercise 3-5 days/week, 5,000-7,000 steps | ×1.55 |
| Very Active | Hard exercise 6-7 days/week, 7,000-10,000 steps | ×1.725 |
| Extremely Active | Physical job + training twice daily, >10,000 steps | ×1.9 |
Weight Loss Calorie Deficits
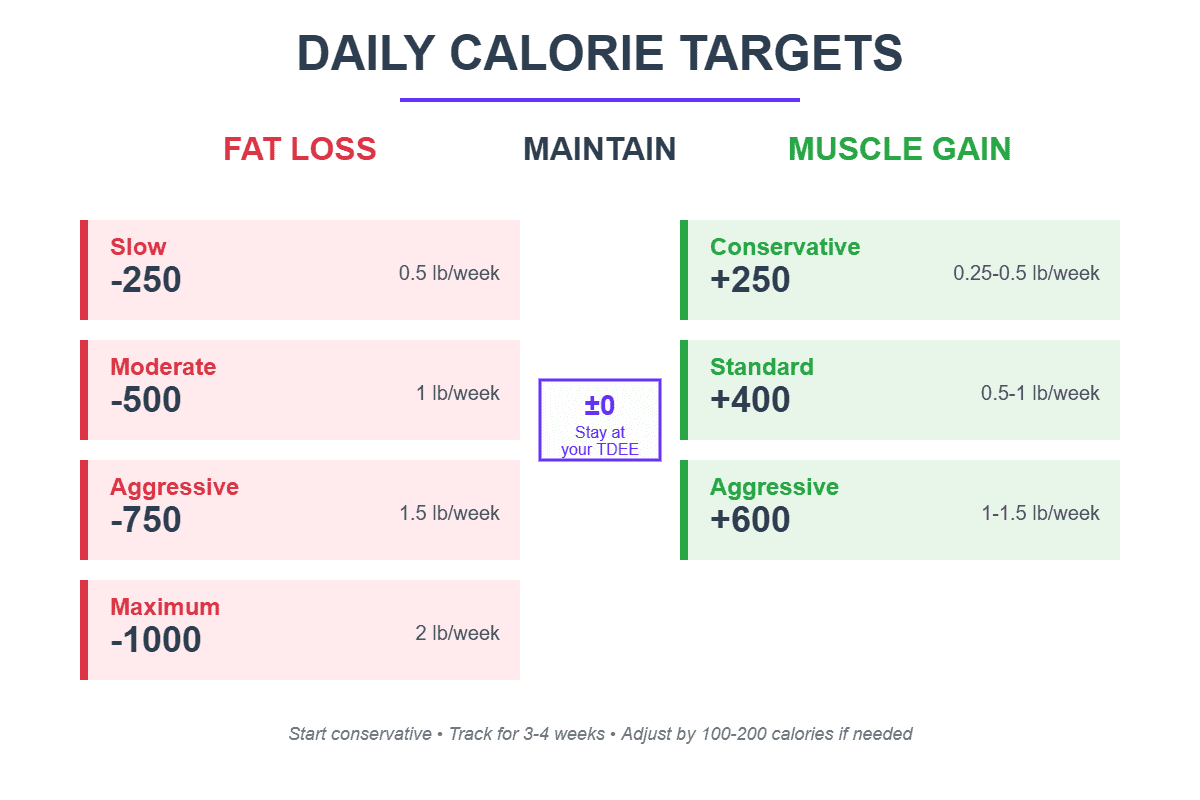
A 500-calorie daily deficit creates approximately 1 pound weekly loss. Adjust based on your starting weight and goals.
| Goal | Daily Deficit | Weekly Loss | Best For |
|---|---|---|---|
| Slow Cut | -250 cal | 0.5 lbs | Last 10-15 pounds, maintaining strength |
| Moderate Cut | -500 cal | 1 lb | Standard fat loss, good muscle preservation |
| Aggressive Cut | -750 cal | 1.5 lbs | Significant weight to lose (30+ pounds) |
| Maximum Cut | -1000 cal | 2 lbs | Obese individuals only, medical supervision advised |
Minimum Calorie Thresholds
Women: 1,200 calories daily minimum (Harvard Medical, AHA, Academy of Nutrition)
Men: 1,500 calories daily minimum (same sources)
Muscle Gain Calorie Surplus
Building muscle requires surplus calories, but bigger isn’t better. Research shows 5% surplus as effective as 15% for muscle building. Larger surpluses primarily add fat.

Protein Requirements by Goal
| Goal | g/lb Bodyweight | g/kg Bodyweight | Example (175 lb person) |
|---|---|---|---|
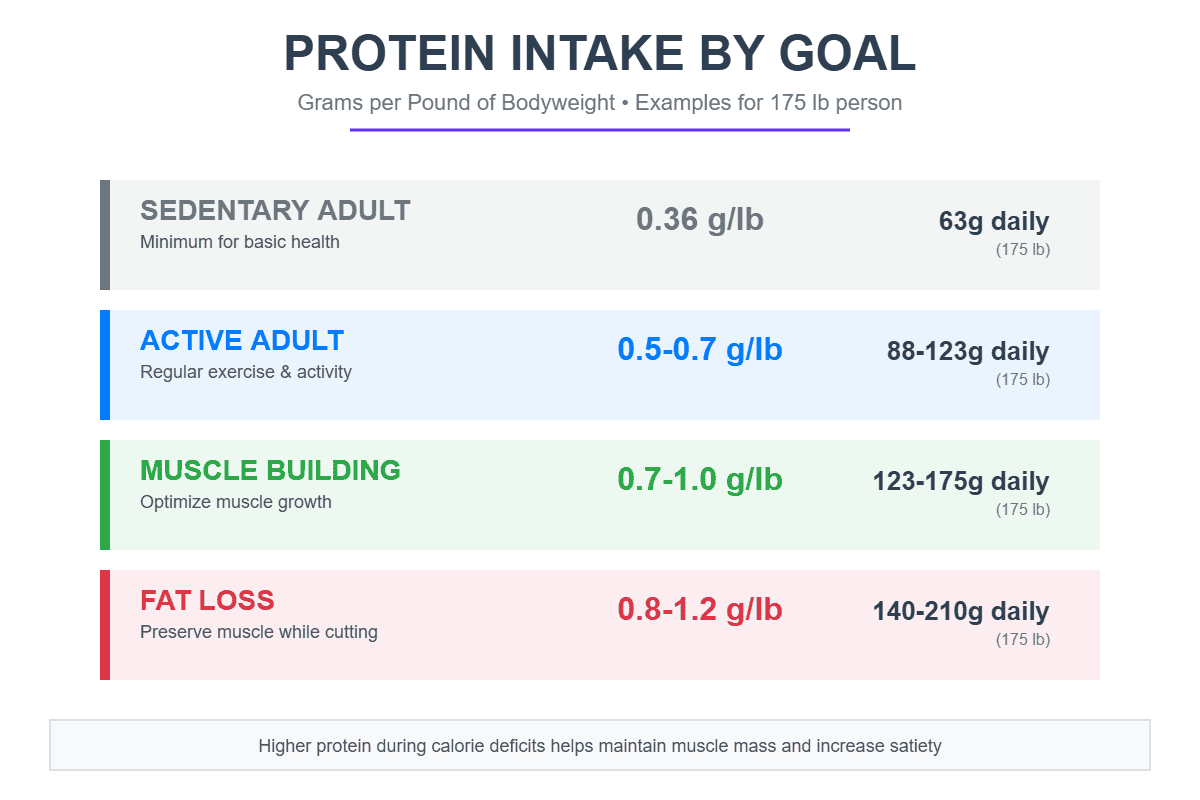
| Sedentary Adult | 0.36 | 0.8 | 63g |
| Active Adult | 0.5-0.7 | 1.2-1.6 | 88-123g |
| Muscle Building | 0.7-1.0 | 1.6-2.2 | 123-175g |
| Fat Loss | 0.8-1.2 | 1.8-2.7 | 140-210g |

Macro Split Guidelines
After setting protein, fat needs 0.3-0.5g per pound bodyweight minimum for hormone function. Carbs fill remaining calories.
Calorie Calculator Limitations
All formulas predict population averages. Individual variation means your actual needs may differ significantly from calculated values.
Expected Accuracy Ranges
Average prediction error runs ±325 calories. Use calculated numbers as starting points, then adjust based on 3-4 weeks of tracking actual weight changes.
Tracking Implementation
Accurate tracking requires consistency. Weigh foods raw before cooking when possible. Digital scales provide better accuracy than measuring cups, and don’t forget to adjust your recipes, a recipe conversion calculation would help scaling the ingredients down.
| Food Type | Best Tracking Method | Accuracy Notes |
|---|---|---|
| Proteins (meat, fish, eggs) | Weigh raw, grams | Cooking reduces weight by 20-30% but not calories |
| Rice, pasta, grains | Weigh dry before cooking | Absorbs 2-3× weight in water when cooked |
| Oils, butter, dressings | Measuring spoons or weigh | Easy to underestimate, very calorie dense |
| Vegetables | Volume estimates acceptable | Low calorie density makes precision less critical |
| Packaged foods | Weigh against label serving | Actual weight often differs from stated serving size |
When to Adjust Calories
Track weight daily and calculate weekly averages. Daily fluctuations of 2-5 pounds are normal due to water retention, food volume, and hormones.
Adjustment Protocol
Common Tracking Errors
Age-Related Metabolism
Metabolism declines 2-3% per decade after 30, primarily from muscle loss rather than aging itself. Active adults maintaining muscle mass experience minimal metabolic slowdown.
| Age Range | Metabolic Changes | Calorie Adjustments |
|---|---|---|
| 18-30 | Peak metabolic rate, easiest muscle building | Use calculated values directly |
| 30-50 | 5-10% decline if muscle mass not maintained | Minimal adjustment needed if active |
| 50-65 | 10-15% decline typical, reduced NEAT | May need 100-200 fewer calories than formula suggests |
| 65+ | 15-20% decline, higher protein needs | Reduce calculated needs 10-15%, increase protein to 0.5-0.6g/lb minimum |

