Channel Geometry
Flow Parameters
Boundary Conditions
Water Surface Profile Data
Manning’s n Reference Values
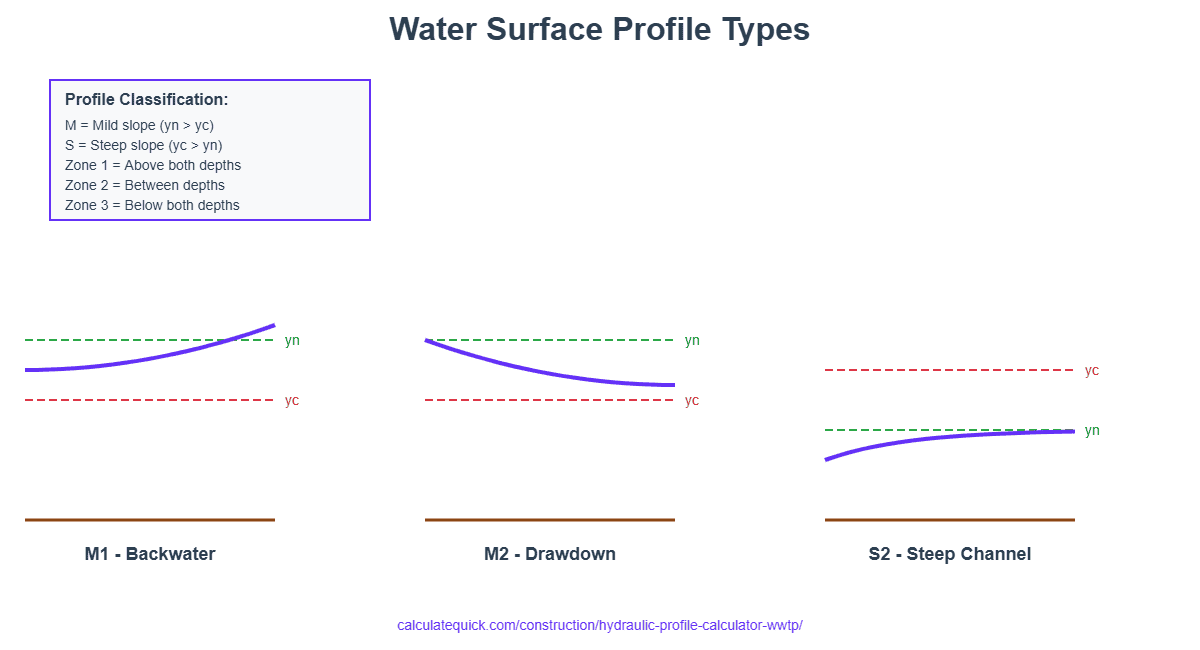
Hydraulic Profile Types: What the Letters Mean
The calculator returns a two-letter code like M1, S2, or H3. The first letter tells you about your channel slope: M means mild slope (water flows slower than critical), S means steep (faster than critical), C means critical (right at the boundary), and H means horizontal or very flat.
The number indicates where your water depth sits. Type 1 means deep water above both normal and critical depth – you’ll see this upstream of dams where water backs up. Type 2 means water depth falls between normal and critical – common at channel transitions. Type 3 means shallow water below both reference depths – typical downstream of gates or steep drops.
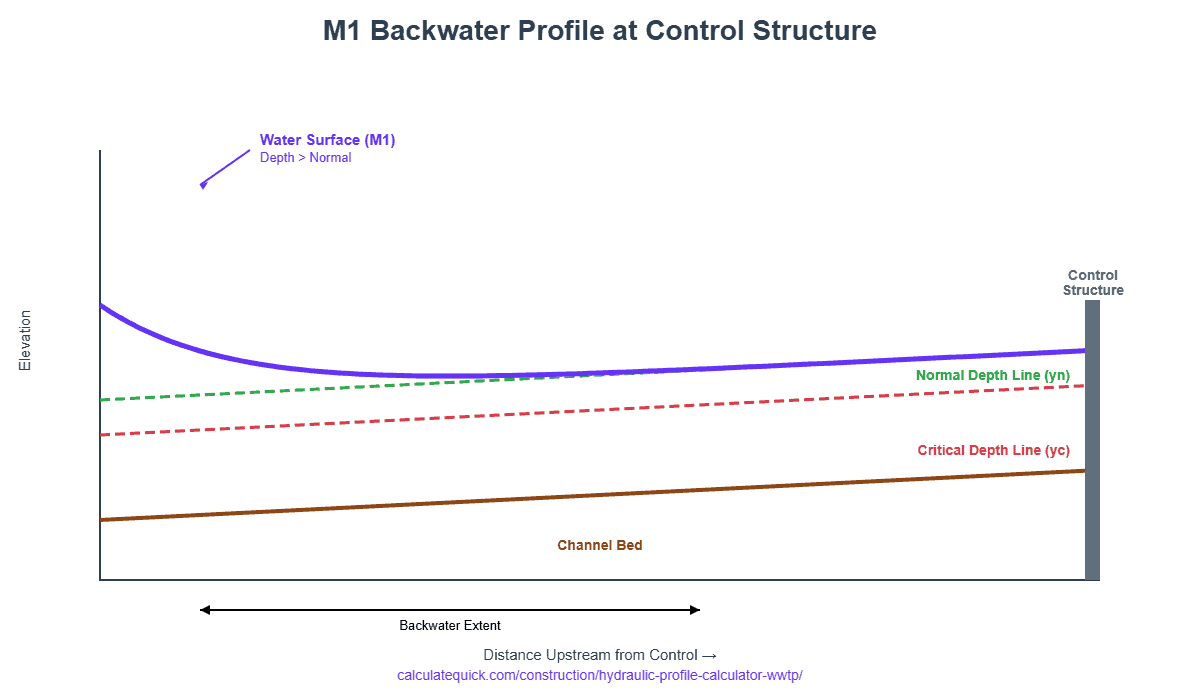
M1 profiles appear when something blocks flow downstream like a dam or weir. Water piles up and the surface slopes gradually upward as you move upstream. M2 profiles happen when channels get steeper or end at waterfalls – water speeds up and depth decreases moving downstream. M3 profiles form when fast flow hits a flatter section and suddenly slows down, creating a hydraulic jump.
When Normal Depth Equals Critical Depth
Your channel operates at critical slope when these two depths match. This creates unstable flow conditions where small changes in depth or discharge cause large changes in water surface. Design channels to avoid critical slope by making them either clearly mild or clearly steep.

Choosing the Right Manning’s n Value
Manning’s n measures how rough your channel surface is. Smooth troweled concrete uses 0.011 to 0.013. Rough concrete or gunite ranges from 0.014 to 0.017. Clean earth channels without vegetation sit at 0.022 to 0.025. Earth channels with grass use 0.030 to 0.035. Channels with brush and weeds jump to 0.050 to 0.080. Dense vegetation or natural streams reach 0.100 to 0.150.
Pick values from the higher end of each range for design work. Channels get rougher over time as sediment accumulates, vegetation grows, and surfaces age. A clean earth channel at 0.022 today might be 0.030 in three years without maintenance. This affects water depth by 15-20% in typical channels.
Seasonal changes matter for vegetated channels. An irrigation canal with aquatic weeds might use n = 0.030 in winter when plants are dormant but n = 0.060 in summer when growth is heavy. Calculate profiles for both conditions if your channel faces seasonal vegetation changes.
Normal Depth vs Critical Depth
Normal depth is what you get in a long, uniform channel after flow has stabilized. Friction balances gravity and depth stays constant. This depth depends on your channel shape, roughness, slope, and flow rate. Change any of these and normal depth changes too.
Critical depth is the depth where flow transitions between slow and fast regimes. It depends only on channel shape and flow rate – roughness and slope don’t matter. Water at critical depth flows at the exact speed that small waves can travel upstream. Deeper than critical means subcritical flow where upstream conditions control what happens downstream. Shallower means supercritical flow where downstream conditions can’t affect upstream.
Compare these two depths to understand your channel behavior. When normal depth exceeds critical depth, you have a mild slope channel with subcritical flow. When critical exceeds normal, your slope is steep with supercritical flow. When they match, you’re at critical slope where flow is unstable.
Circular Pipes Running Partially Full
Circular channels flowing half full don’t carry half the full-pipe capacity. Maximum capacity occurs at 93% depth because the wetted perimeter grows more slowly than the cross-sectional area. A pipe at 80% depth carries 95% of full capacity. Design storm drains to flow 50-80% full at normal conditions so you have capacity for peak flows.
Common Input Mistakes
Enter slope as a decimal, not a percentage. A 1% slope is 0.01, not 1. A 1 in 1000 slope is 0.001. Getting this wrong makes your calculated depths completely meaningless. Double-check that your Manning’s n matches your actual channel material – using concrete values for an earth channel gives depths 30-40% too shallow.
Interpreting the Profile Graph
The purple line shows your actual water surface elevation along the channel. The brown line is the channel bed. The green dashed line marks normal depth – where water would settle in a very long uniform channel. The red dashed line shows critical depth – the transition point between flow regimes.
When the water surface runs parallel to the channel bed, you have uniform flow at normal depth. When it curves upward moving upstream, you have backwater from a downstream obstruction. When it curves downward, flow is accelerating toward a drop or transition.
Watch where the water surface crosses critical depth. This marks a control point where flow transitions between subcritical and supercritical. You can’t compute through these points with gradually varied flow methods – they require special analysis for hydraulic jumps or critical flow sections.

Setting Up Your Calculation
Start with the downstream boundary condition for subcritical flow or upstream for supercritical. The calculator needs a known depth at one end to compute the profile. For channels draining to lakes or reservoirs, use the lake elevation. For channels ending in free falls, use critical depth at the brink. For channels connecting to larger waterways, use normal depth in the receiving channel.
Pick a reach length that covers your area of interest. Longer reaches show more of the profile but may miss details in rapidly changing sections. For backwater from a dam, calculate at least 3-5 times the expected backwater length upstream. For transitions between channel sections, include 10-20 times the depth change distance on each side.
The calculator divides your reach into 50 steps automatically. This works well for most channels but may lose accuracy near critical depth where the profile changes rapidly. If your results look unrealistic near critical depth, try shorter reach lengths or check that you haven’t violated the gradually varied flow assumptions.
Practical Design Applications
Storm drain design uses these profiles to verify that water levels stay below inlet grates during heavy rain. Calculate the profile starting from your outfall and working upstream through the pipe network. If the profile shows water backing up above pipe crowns, you need pressure flow analysis instead. If water surfaces exceed inlet elevations, you’ll get surface flooding.
Irrigation canals need profiles to set bank heights. Calculate profiles for maximum flow to check freeboard (the distance from water to bank top), normal flow to verify turnout depths, and minimum flow to ensure control gates can still regulate properly. Bank height equals maximum water surface elevation plus 0.3 to 0.6 meters freeboard depending on channel velocity and width.
Bridge designs require backwater analysis to show how piers and abutments affect upstream flood levels. Calculate one profile for existing conditions and another with the bridge in place. The difference is backwater rise. Most agencies limit this to 0.3 meters for 100-year floods to avoid flooding upstream properties.
Channel Velocity Limits
Earth channels without lining erode at velocities above 1.0 to 1.5 m/s depending on soil type. Grass-lined channels handle 1.5 to 2.0 m/s. Riprap protection allows 3.0 to 4.5 m/s. Concrete channels sustain 5 to 6 m/s. Check the velocity column in the profile data table against these limits. If velocities exceed allowable values, increase channel size, reduce slope, or add lining.
Minimum velocity matters too. Velocities below 0.5 m/s allow sediment deposition and vegetation growth that reduce capacity over time. If your profile shows velocities under 0.5 m/s, consider steeper slopes, smaller sections, or periodic maintenance to remove accumulated material.
When This Method Doesn’t Work
Gradually varied flow analysis assumes flow changes slowly over distance. This breaks down at hydraulic jumps where depth changes abruptly over a few meters. If your profile approaches critical depth from below in a steep channel, a jump will form rather than the smooth curve shown. Use momentum equations to find jump location and sequent depth.
Rapidly varied flow at gates, weirs, and sharp transitions needs different analysis methods. The calculator treats these as boundaries where you specify known depths, but it can’t compute the local flow patterns at the structure itself. Use weir equations, gate discharge formulas, or orifice flow relationships for the structure, then use profile calculations for the reaches upstream and downstream.
Very flat channels with slopes under 0.0001 may show numerical instabilities where tiny changes in input create large changes in computed depths. This happens because energy losses become very small relative to depth changes. Consider using normal depth throughout these channels rather than profile calculations if slopes are extremely flat.